Tuesday, November 24, 2015

Re-writing the example code from Chaos and Fractals


I stumbled on an interesting book on fractal algorithms: Chaos and Fractals: New Frontiers of Science.  What made me take notice was that each chapter ended with a short, approachable example program that demonstrates a concept.  The programs also generate some neat-looking fractal diagrams, and IMHO it's always fun to play around with algorithms that generate pictures.

Another interesting point was that, in the first edition of the book, each example program was written in the BASIC programming language. The choice of BASIC doesn't seem so odd with a little historical context.  The book was published in 1992, and around that time there weren't very many good cross-platform programming languages, especially when you consider cross-platform drawing libraries.  But, at the time, BASIC fit the bill.  It could run on DOS-based PCs and Apple IIs, which, at the time, probably covered a pretty good swath of the audience for the book.  Most BASIC dialects also included the LINE and PSET functions which were all the example programs needed to draw the output of all sorts of fractal algorithms.  In hindsight, BASIC seems like a decent choice.  In the second edition of the book, I believe the authors switched to something else like Java applets; I was working from a first edition copy from my local library so I don't know much about the second edition.

I decided it would be a fun exercise to port these example programs to javascript, since that seems to be the new cross platform language of choice in this decade.  I tried to reproduce them as faithfully as possible without any attempt at further optimization, and I tried to use as few non-BASIC language constructs as possible.  I say few as possible, since many BASIC language constructs don't have direct analogous constructs in javascript, for instance GOTOs and labels.  So I present to you below, my implementation of these examples.

I ran into a few caveats during the porting process that are worth mentioning:

  • To view my javascript source, just choose View Page Source and you should be able to look around and find the example code.
  • Most of these algorithms are recursive and I had to get a little imaginative when converting GOTOs and GOSUBs to proper function calls.
  • For displaying the graphical output of each program, I used the HTML canvas object.
  • I tried to leave the BASIC code as comments amongst the javascript code so in case you're following along with the book you'll have some guide posts in the code.
  • The example code uses several different invocations of the LINE and PSET functions, and I had to track down some BASIC language documentation to figure out what the invocations should do.  As a result, it seems that the BASIC dialect used is closest to GW-BASIC and QuickBASIC.
  • The output from the programs for chapters 12 and 13 did not look like the diagrams in the book and I spent quite a bit of time debugging them looking for my error.  In the end I downloaded the DOSBox emulator and a copy of QuickBASIC and ran the programs there.  In both cases, the BASIC code ran but outputted exactly the same result that I got from my javascript version.  So I can only conclude that there is an error either in the code or the diagram printed in the book.
  • Some of the programs take a while to run (especially chapter 12 and 14), and this can lead modern browsers to display errors that the browser tab has hung or otherwise failed.  In the chapter 12 code I tried to mitigate this somewhat by adding chunking code to sleep between chunks of loop iterations.  It's less noticeable in chapter 14, but if you run into issues you can often get around it by just reloading the page and trying again.


Chapter 1: Graphical Iteration
Chapter 2: Sierpinski Gasket
Chapter 3: The Koch Curve
Chapter 4: The Cantor Set
Chapter 5: Iterating the MRCM
Chapter 6: Chaos Game for the Fern
Chapter 7: L-systems
Chapter 8: Cellular Automata
Chapter 9: Random Midpoint Displacement
Chapter 10: Times Series and Error Development
Chapter 11: Final State Diagram
Chapter 12: Rossler Attractor
Chapter 13: Julia Sets
Chapter 14: Mandelbrot Sets

Monday, December 22, 2014

Brewing Beer with a Sous Vide Cooker


In beer brewing, the techniques that you use to extract the sugar that the yeast turns into alcohol are very important.  Sugar is pulled from malted grain by soaking it in hot water, which is called mashing.  The temperature of the water, and the length of time the grain is soaked makes a very big difference in the amount of sugar extracted.  The amount of sugar received is determined by measuring the density of the resulting water using a device called a hydrometer.  The ratio of extracted sugar compared with the theoretical maximum amount of sugar is called efficiency and is usually somewhere around 75%.

In addition to getting the sugar out of the grain, soaking the grain can have other effects by breaking down various proteins which can effect the flavor, the amount of head, and other factors in the resulting beer.  In order to get some of these secondary effects brewers can do multi-rest mashes where they soak the grains at different temperatures for different amount of time.  If you want more homebrewing theory, check out Palmer's excellent book.

All of this is difficult to do in the real world when all you are armed with is a stove with a knob that, when turned, will eventually change the temperature of the 5 or more gallons of water and grain.  Basically, it turns into doing a kind of human-powered PID controller, which is no fun at all.

Being an engineer, I thought that this definitely falls under the category of a task that a computer could do better than a human.  I started doing some planning in my head about what would be required for some kind of computing device to control my stove (or other heating element) so that I could set an exact temperature and let the computer worry about keeping the beer at the temperature.  It turns out that it's not hard since this kind of temperature control is used in industry all the time for many purposes besides mashing beer.

The auto mash temp control project was sitting solidly on the back burner in my brain when I saw that Sous Vide cookers were getting cheaper.  I will spare you the details, but Sous Vide cooking is a method of cooking by putting food in a water bath that is kept at an exact temperature by a temperature controller.

If you replace the water with wort (unfermented beer) then this sounds exactly like what I wanted to control mash temperature.  Sous Vide cookers operate in the same temperature range as typical mash temperatures, are generally made from food-safe materials, and are made to attach to the sides of standard cooking pots. All of these qualities make them ideal for use with a mash.

So I bought an Anova Sous Vide cooker and made a batch of beer, and the results were excellent.  I made this Irish Dry Stout recipe, with a mash temperature of 152 degrees F for 90 minutes, and a 170 deg mash out for 10 minutes.  In the end I got 75% efficiency, and I pretty much sat back and relaxed during the mash step instead of a typical batch where I have to watch the temperature like a hawk the whole time.

Footage of the mash and details and tips for using the Anova cooker with a mash are in the the video above, but the big takeaways are:
  1. The Anova cooker seems to work quite well for mashing, and I will definitely use it again.
  2. Only use the cooker for fine-tuning the mash temperature.  For brute force heating use your stove burner.  This is to avoid caramelizing any sugars to the Anova's heating cool which would make the Anova hard to clean and may effect the flavor of the beer.
  3. Use a grain bag.  This keeps the grain from plugging up the innards of the Anova.  Be careful about where you aim the output of the Anova's circulator such that the grain bad doesn't get pulled into the Anova's intakes.
  4. Carefully calculate batch size.  The liquid level must fall within the Min and Max lines on the Anova and this can be tricky to hit correctly when using a large brew pot, so do your math ahead of time to get it right.
Disclaimer: I don't know if Anova recommends using their Sous Vide cooker in this way, so I can't be responsible for any damage to the Anova cooker, problems with the resulting beer, or any other issues or problems you might encounter.

Monday, December 15, 2014

Quiz Show Buzzers


Recently I got a commission to create a set of quiz show buzzers.  There was nothing on the market that really fit what my client was looking for so they had me build something for them.  I found this instructable which was similar to, but not exactly, what the client wanted so I used that project as inspiration.

I made a video above which shows some of the steps during development as well as the finished device.

The basic requirements were:
  • A control unit for the person running the game to see the order that players pressed their buttons.
  • Four remote units that connect to the control box.  The remote unit should light up such that both the player and audience can see which player rang in first.
  • A sound should play when the first player rings in.  The preference would be for the sound to be something like the Family Feud ring in sound.
  • As a bonus it would be nice to have the cables between the remote boxes and the control unit be something that is easily replaceable in case longer cable lengths are needed in the future.
Software and Electronics
I started with an Arduino because, for simple devices like this, it is the quickest way for me to get started.  More specifically, I used a RBBB from Modern Device, since it is a cheap way to embed an Arduino in a project.

For the LEDs, I started with some old LEDs that I had lying around, but quickly found that they weren't bright enough to use with the ping pong ball diffusers I used for this project.  I ended up buying some new higher efficiency LEDs.  I tweaked the current limiting resistors for each different color of LED to maximize their drive current (and therefore brightness).  See the video for a demonstration of the LEDs.

I hadn't ever really done much with sound on the Arduino before so this was new territory.  I found that I could embed a WAV file (after re-encoding it as an array of data in the Arduino sketch), and then play it back using the PCM library.  I also found the ring-in sound from Family Feud on this website, which was really handy.

I struggled a bit getting the sound hardware working.  It's pretty easy to connect a speaker directly to an output pin from the Arduino, but that wasn't loud enough in my case where I wanted an entire room to hear it.  So I needed an amplifier of some kind, and I tried a number of different ones, but none seemed to work very well.  Eventually I found this site with the simplest amplifier of all, just a transistor and resistor.  This worked fantastically well, and required almost no work or expense to get it going!  You can see my circuit in the schematic.

I whipped up some more code to time the inputs to detect which player rang in first using the pin change interrupts on the Arduino.  This was easy using the handy PinChangeInt library.

Last of all for the software, I needed to create several different blink patterns on the LEDs.  Again an existing Arduino library came to my rescue in the form of the TimedAction library that allows you to setup psuedo-thread functions to run arbitrary code on a configurable time period.

Hardware
The prototype was now complete but I had to assemble the final version.  I decided to use headphone jacks to connect the remote boxes and the control unit together.  In this way I could carry the signals I needed over an inexpensive patch cable and make the all of the boxes easily detachable for storage.

As mentioned before, I used ping pong balls as inexpensive light diffusers attached through holes in the button boxes and held in place with hot glue.  The large buttons were attached through a hole in the top of each button box.  The speaker in the control box was attached with hot glue with a piece of screen placed in front of the speaker before gluing.

Assembly was much more time consuming than I thought.  Many hours of cutting, drilling, and soldering later, I had the final product which you can see in the video above.  My projects always seem to take way more time in the less interesting mechanical parts than in the super-fun electronics and software parts...

I got everything done in time and my client has been happily playing rounds of Jeopardy and trivia games for months now.

And now you get the benefit of all that work in the form of source code and schematics:
schematic (sorry, it's hand drawn)

Monday, December 08, 2014

Talking to an Arduino on Android with USB OTG


As part of the Thinkery robot project, we planned on creating an interface for the robots via a 7 inch Android tablet.  The tablet was supposed to display things like sensor readings and play videos and music when the robots went into dance mode.  In the end we didn't have time to finish this Android app, but I did some work in figuring out how the Android tablet and Arduino would communicate with each other.

Interfacing between an Arduino and Android devices is nothing new, the Amarino framework does it, and the MIT app inventor makes it really easy.  The downside of this and many of the existing examples is that they require the Arduino to have a bluetooth interface.  Using bluetooth for the interface is great if you need the connection between the Arduino and Android device to be wireless, but there are downsides to this approach.  First, the cost increases on the Arduino side; a bluetooth interface can cost as much as the Arduino itself.  Second, the Arduino must have its own power source, since there is no easy way for it to leech off the Android device's power supply if there is no wired connection to it.

I should mention here, for the sake of completeness, that there is another alternative besides using bluetooth: various IOIO boards.  These board connect through USB to an Android device and provide IO capabilities similar to an Arduino.  IMHO, these board still have some downsides: 1) they are still more costly than a standard Arduino board, and 2) they still require an external power source (they can't get their power from the Android device's USB port).

Since the robots were going to contain both a an on-board Arduino and Android tablet it made more sense to have a direct (wired) connection between the two.  I knew from my experiences with Linux (Android runs on top of Linux), that it is certainly possible for a portable device to act as a USB host using USB OTG.  So after a bit of searching I figured out that most recent Android devices do support USB OTG and have the correct drivers included to interface to USB serial devices (the Arduino enumerates as a USB serial device).

The next problem was how to physically connect the Arduino to the Android device.  Most Android devices have a female microUSB connector and the Arduino has a female USB-B connector.  To connect between them I got a USB OTG adapter from Monoprice.  An interesting side note is that the USB OTG adapter works equally well to connect a keyboard or flash drive to an Android device.

After even more searching, I found a very useful Android library that makes it easy to interface to USB serial devices.  While trying to build the example app I found that it was actually a little easier to use this fork of the original library project.

To test with my Android tablet (a Nexus 7), I programmed my Arduino with a simple sketch that sets the baud rate to 115200 and prints an integer string to the serial port every second, then I compiled and installed the example app from the USB serial library project and connected the Arduino to the Nexus.  It detected the new USB connection immediately and launched the Android app, and I could see my integers happily printing!

I then modified the example app to include a button which, when pressed, sends data to the Arduino.  On the Arduino side, the received data turns an LED on and off.  I uploaded my final code to this github repo.

In the end, we didn't have time to flesh out the Android interface for the Thinkery Robot Army, but it is certainly a useful tool for a future project.

Monday, November 24, 2014

Thinkery Robot Army

Recently I did some volunteer work with the Thinkery, which is a a children's museum here in Austin.  They wanted several simple robots that they could take around town and show off to schools and similar places to drum up interest in the museum.

I got pulled in to help with the Arduino "brain" of each robot.  I mostly wrote the firmware for the Arduino but also did some of the circuit design.

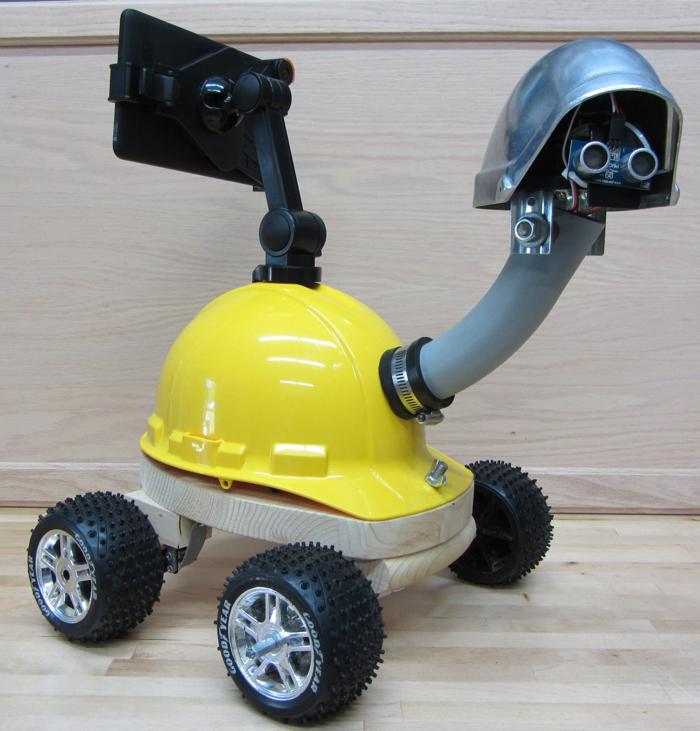
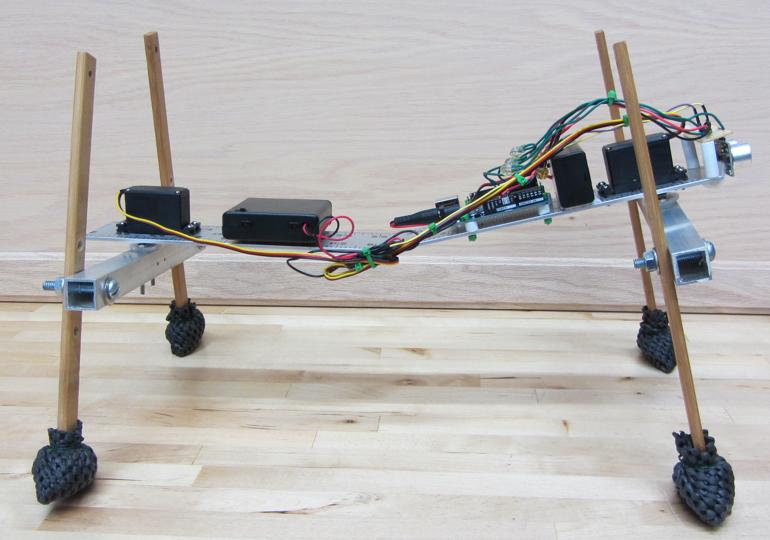
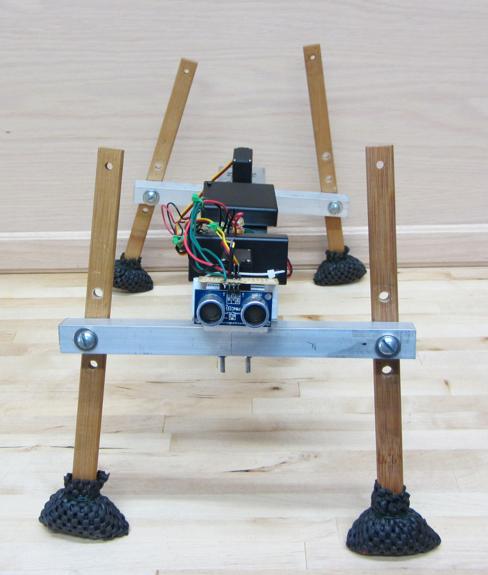
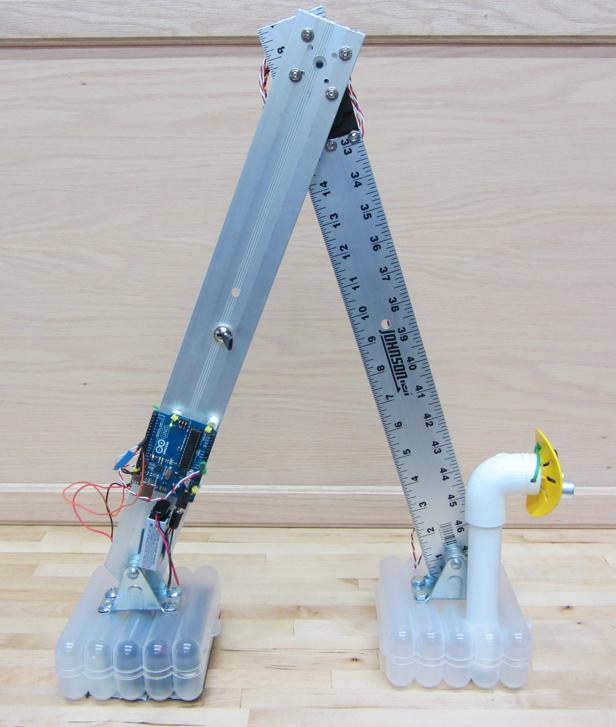
All of the robots runs a basic object avoidance routine and, just for fun, each 'bot periodically stops what it's doing and runs a dance sequence.  The robots turned out pretty well; here's a look at them:

TurtleBot

The TurtleBot is a four wheeled robot.  Two continuous rotation servos run the wheels, one positional servo turns the head left and right.  An ultrasonic range finder is mounted in the head.  The robot travels forward until it encounters an obstruction, then it looks left and right to see if there is a clear path.  If it detects a clear path it turns in that direction and continues forward.

The tablet mount you can see in the picture was meant to hold a 7 inch Android tablet that would interface with the 'bot, but we ran out of time to implement that.  The beginnings of an Android app to interface with the 'bot is here.

An instructable with construction details is here and the Arduino source code for TurtleBot is available here.

PawsBot

PawsBot consists of a ultrasonic sensor, and two positional servos.  It walks forward on stilt legs until an obstruction is encountered then it backs away.  It doesn't have the ability to turn left or right.  The trickiest part of this robot is getting the legs adjusted correctly such that its gait is correct; the bend in the middle of the robot is important for that.

An instructable with construction details is here and the Arduino source code for the PawsBot is available here.

LegBot

LegBot is the simplest robot of the three; it's only a positional servo and an ultrasonic range finder.  It works by moving it's legs with a scissor motion and since one foot is more heavily weighted than the other (one foot contains the batteries) it slowly moves forward.  Since the 'bot has no way to move backward or turn, it stops when it encounters an obstruction.

An instructable with construction details is available here and the Arduino source code for the LegBot is available here.

Wednesday, November 12, 2014

Evolution of a DIY PVR

Almost 10 years ago, I wrote an article for Make magazine about building a DIY digital video recorder (DVR).  At the time, there weren't any devices available, outside of subscription-based devices like Tivo, to help record TV.

My DIY device served me well for several years, but I get occasional questions on how or if I've updated my recorder, since much of the software and hardware I used at the time is now obsolete.

The answer is that I have been steadily upgrading that recorder during the intervening years, since there still isn't a commercial DVR on the market that meets my needs.

My original rig


The original article was here, but it appears to have been taken down, although the comments are still viewable. There is still a re-print of the article here.  Here is a brief summary of the components of that system:
  • Hardware: Dell Dimension 4500 with 512MB running Windows 2000 and a Hauppauge WinTV-PVR-250 TV card
  • BeyondTV: For TV recording, scheduling, and live TV overlays
  • WinDVD, Winamp, SlimServer: For media playback and streaming
  • Various console game emulators
  • Girder automation software: To create on-screen launcher menus
  • Cygwin and server software: For Linux-like ftp and ssh servers

Switch from BeyondTV to NPVR

Some time went by and I was getting annoyed with the amount of maintenance required to keep the machine up and running.  Various software components were always crashing and otherwise costing me time.  I started by removing the cygwin software because I wasn't using them enough to justify the time commitment.  At this point I also upgrade the PC I was using to Windows XP.

I also switched from using BeyondTV to NPVR (now called NextPVR).  NPVR had more features, such as DVD playback, and a good plugin system which allowed me to get rid of the extra media playback software like WinDVD.  I was also able to absorb the emulators into the NPVR interface using a plugin.  And best of all, NPVR was free!

The dominoes kept falling and since all of the functionality I needed was handled by NPVR, I got rid of the Girder-based menu system.

Streaming video to Roku
Up until this point I had my PC directly connected to my TV, but around this time, streaming set-top boxes were becoming inexpensive.  So I grabbed a Roku box, and found an obscure way to play media files from my local network, called the MyMedia channel.

While the MyMedia channel worked well, it needed a very particular video format, so I wrote a python script to transcode the video that NPVR produces automatically for me.  The script monitors a directory location for new files and then transcodes them using Handbrake and moves the resulting files to a location where the MyMedia server will pick them up.

I later added some more advanced features like also making the script monitor incoming video from bittorrent, and also making it intelligently rename the files and sort them into my existing video library.  I also made the script act as a simple system monitor and restart troublesome processes automatically to avoid crashes, hangs, and poor performance, which were a continual problem since I was still running on an old Windows XP box.

I also had a few more service running on the box, such as a Subsonic server for music streaming, a Ventrilo server for voice chat while playing games with friends,  an apache server to serve up my electronic parts database, a uTorrent client with a remote web interface.

Somewhere around this time I also invested in a Chromecast, and found I could use an app, Localcast, to stream media files to my TV.  This acts as a good backup to the Roku.

At this point I had a distributed video streaming network, with a central media server, and a remote web administration interface provided by NPVR.  This served me well for about 5 years.

Transition to Linux
About a year ago the coming demise of Windows XP and my growing fascination with Linux converged to make me take the plunge and re-implement my PVR on a Linux box.  I chose to go with Linux Mint 17 as my distro.

I had to port over all of the services that had been on my Windows box:
  • MyMedia server - cross-platform python script, so it just works
  • Subsonic - debian packages available
  • uTorrent - Switched to Deluge, since, at the time of this writing, the Linux version of uTorrent isn't robust
  • Ventrilo -  Linux versions available
  • transcoder script - python script, required a little bit of porting for paths and the like
  • Handbrake - needed by transcoder script, Linux versions available
  • smb file system support for streaming via LocalCast
  • various server software - apache, php, mysql, ssh, etc.
Most of those packages didn't have proper init scripts to make them run at system startup, so I wrote scripts for those that didn't have them.

My server is now much more stable and trouble-free, owing to the fact that Linux is better designed for running servers.  This also gave me a useful platform for software development, such as Node-Red,  and a private git repo for source code control.

Future Plans
Even though my current server box (can it even be called a PVR any more?), I still have some improvements I would like to make:
  1. Install mythtv so that I can record TV again.  You may have noticed that I didn't mention porting over to a replacement for NPVR.  Mythtv is that replacement, but I don't record that much TV anymore so I haven't yet bothered to take the time to set it up.
  2. Try out the Plex media server as a possible replacement to the MyMedia channel.  I've had multiple people recommend Plex to me for local media streaming and I'd like to give it a try and see if it's worth the fuss.

Wednesday, October 29, 2014

First steps with Node-RED

In my ongoing quest to find a good home automation software framework to run the hardware I built, I discovered Node-Red.  Node-Red is the self-professed "visual tool for wiring the Internet of Things".  Sounds promising.

Node-Red is a graphical programming environment based on node.js.  (Node.js is basically server-side javascript). Since it's built on node.js, Node-Red can run anywhere node.js runs.  It's all open source, and was started by IBM.


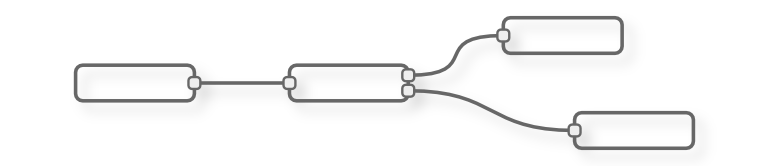
The interface to Node-Red runs completely in a web-browser, so there's no need to install anything on your development machine, and it is even usable from a mobile browser. It works by connecting wires between different functional nodes, kind of like the picture above.  There are lots of different nodes that do various things, from interfacing to a WeMo light switch to accessing emails from a Gmail account.

There is no built-in UI in Node-Red, but I think that might actually be an advantage.  It has numerous methods of connecting to a custom UI, and this way, you don't restrict users to a default UI that might not suit their application.

I got interested in Node-Red because I saw several different people using it to do home automation with JeeNodes.

Installation
I mostly followed the instructions here to install Node-Red to an old laptop running Xubuntu.

First I installed the Node.js package manager and Node.js itself:
sudo apt-get install npm
sudo apt-get install node

Then I downloaded the latest release zip file from nodered.org and unzipped to ~/dev
cded into that dir and ran 'npm install --production'.

Next up I launched Node-Red it by doing 'nodejs red.js'.  Running 'node red.js' doesn't work since the debian packages install it as nodejs to avoid a conflict. Eventually I ended up symlinking node to nodejs to make things easier:
ln -s /usr/bin/nodejs /usr/bin/node

And with that Node-Red seems to be up and running.

Node-Red ships with a pretty good set of basic nodes, but there is also a git repo that has even more nodes, so I thought I'd try that out.  I installed the extra nodes by doing 'cd nodes; git clone https://github.com/node-red/node-red-nodes.git'.

It should be noted that many of these additional nodes rely on node.js libraries and until those libraries are installed, the new node will not appear in the Node-Red palette.  As an example, if I want to use the suncalc node to generate an event at sunrise every day, I would need to install the suncalc library by doing 'npm install suncalc'.

Hello World
I ran through the initial tutorial and was successful.  Programs in Node-Red are called "flows". The basic design pattern in Node-Red is: drop and config nodes, wire them together, hit deploy.  Pretty simple, and even better, it actually works.

The debugging is a little simplistic in that you can print values to a debug log.  But again, it's simple, and it works, so I can't complain too much.

Flows can be exported as a json string, and imported by the same mechanism.  For the rest of this post I'll post the exported json for the flows I've used.

Controlling  execution
The Node-Red documentation has a good "hello world" tutorial, and has a tutorial on creating new plugin nodes, but it's a little sparse beyond that.  I did some experiments to figure out how the nodes in Node-Red actually execute.  Here's what I've figured out.

First off, Node-Red is completely event based.  Nothing executes unless an external event triggered it.  The "delay" and "trigger" nodes also allow timing based events to be generated.

The wires between the nodes are there to symbolize a data connection to the previous node.  More specifically the wires are really a graphical representation of how javascript Objects get passed to and from nodes.  These are usually referred to as msg objects and their contents can be somewhat arbitrary but most often contain a data member called payload.

So how can you control whether a node executes, like you can with an "if" statement in most text based languages?  If you return a "null" for any of the outputs then any of the subsequent nodes attached to that output don't execute.  A way to demonstrate that is by creating a function node that has multiple outputs which means you return an array of msg objects.  Any element in the array that has a value of null will prevent the connected node from executing.  By the way, this is exactly how a "switch" node works.  Check out the "demo switch" node in the example flow below.


Here's the example flow I'll be using for the rest of the post:
[{"id":"f64d219e.53a208","type":"inject","name":"","topic":"","payload":"","payloadType":"date","repeat":"","crontab":"","once":false,"x":439,"y":454,"z":"d5a6cdcf.6203b","wires":[["5863bf74.888a3"]]},{"id":"5863bf74.888a3","type":"function","name":"demo switch","func":"msg.payload = \"hello\";\n//return [null, msg];\nreturn [msg, msg];","outputs":"2","x":628,"y":452,"z":"d5a6cdcf.6203b","wires":[["6d0fe6ba.2d2e88"],["d6a0f7c1.e949e8"]]},{"id":"6d0fe6ba.2d2e88","type":"debug","name":"demo out 1","active":true,"console":"false","complete":"false","x":821,"y":407,"z":"d5a6cdcf.6203b","wires":[]},{"id":"d6a0f7c1.e949e8","type":"debug","name":"demo out 2","active":true,"console":"false","complete":"false","x":820,"y":486,"z":"d5a6cdcf.6203b","wires":[]},{"id":"1ec662d2.3b7c25","type":"http in","name":"","url":"/test","method":"get","x":450,"y":277,"z":"d5a6cdcf.6203b","wires":[["dd8cd3d3.17b08"]]},{"id":"9c30b932.4da1e","type":"debug","name":"test URL","active":true,"console":"false","complete":"false","x":850,"y":189,"z":"d5a6cdcf.6203b","wires":[]},{"id":"6b3281a7.0a29c8","type":"http response","name":"","x":841,"y":276,"z":"d5a6cdcf.6203b","wires":[]},{"id":"dd8cd3d3.17b08","type":"function","name":"Gen response","func":"var resp = \"Hello \" + msg.payload.name;\nmsg.payload = resp;\nreturn msg;","outputs":1,"x":665,"y":276,"z":"d5a6cdcf.6203b","wires":[["6b3281a7.0a29c8","9c30b932.4da1e"]]},{"id":"7a4aeee7.85b51","type":"inject","name":"","topic":"","payload":"","payloadType":"date","repeat":"","crontab":"","once":false,"x":424.5182189941406,"y":573.5229034423828,"z":"d5a6cdcf.6203b","wires":[["fbd25db9.042da"]]},{"id":"fbd25db9.042da","type":"function","name":"count","func":"if (context.hasOwnProperty(\"counter\"))\n\tcontext.counter += 1;\nelse\n\tcontext.counter = 0;\n\ncontext.global.counter = context.counter + 1;\n\nmsg.payload = \"local counter = \" + parseInt(context.counter, 10);\n\nreturn msg;","outputs":1,"x":602.5182647705078,"y":572.522876739502,"z":"d5a6cdcf.6203b","wires":[["caaa07a5.3555f8"]]},{"id":"caaa07a5.3555f8","type":"debug","name":"","active":true,"console":false,"complete":false,"x":782.5182189941406,"y":577.5229034423828,"z":"d5a6cdcf.6203b","wires":[]},{"id":"36a0278c.c95fd8","type":"inject","name":"","topic":"","payload":"","payloadType":"date","repeat":"","crontab":"","once":false,"x":424.5182189941406,"y":638.5228900909424,"z":"d5a6cdcf.6203b","wires":[["4b22fcbc.b4dd04"]]},{"id":"4b22fcbc.b4dd04","type":"function","name":"get global count","func":"msg.payload = \"global counter = \" + parseInt(context.global.counter, 10);\n\nreturn msg;","outputs":1,"x":603.5182189941406,"y":634.5229034423828,"z":"d5a6cdcf.6203b","wires":[["f51d7f6a.0ae28"]]},{"id":"f51d7f6a.0ae28","type":"debug","name":"","active":true,"console":false,"complete":false,"x":782.5182762145996,"y":633.5228900909424,"z":"d5a6cdcf.6203b","wires":[]}]

Local and Global variables
Within a function node there is a way to persist data between calls to that node that is both local to that node and global to all nodes.  It's documented pretty well here.  I created a quick demonstration of globals using a couple of function nodes.


First web service
Just to try out what I'd learned I used some techniques from here, and got a working test URL using http in and http response nodes!  Just pass a "name" parameter to the URL and it will print a Hello message.  Something like this: "http://site/test?name=Ken"


Conclusions
I really liked working with Node-Red, and I think I'll probably continue using it.

Pros
  • Open source and actively developed by IBM
  • Web-based development
  • Graphical programming/rule development
  • https and basic http authentication is supported.  See here for more info.
  • Mobile-friendly interface
Cons
  • No built-in UI
  • No built-in database for sensor readings, though there are nodes to interface with various DB formats

Friday, October 24, 2014

Trying out HouseAgent

For the last couple of years I've been looking for some Home Automation software to run the hardware that I'm slowly building to automate my house. There are so many choices that I'm not sure where to start.  I discovered HouseAgent mostly because it's written in Python, and I really like Python, so I thought I'd give it a test drive.

HouseAgent is a python-based home automation tool, with a promising architecture.  It appears that plugins are separate processes that communicate via AMQP, which means they can be written in (almost) any programming language.  It has a web interface, and a simple rules engine.

I installed the latest daily build of House Agent on a Windows 7 machine and ran into some problems.  The main problem was that it wouldn't launch.

After poking around for a while I figured out that you could run the House Agent daemon at the command line to get more info.  Just run 'houseagent.exe debug' to display debug messages.  I quickly discovered that there were files missing, namely houseagent.conf.  I grabbed these files from the git repo and put them in the places the error messages referred to.  The next error I had was that the port it was trying to use was already in use (8080) so I changed that in houseagent.conf.

At this point House Agent successfully launched, and I could get to the main web interface.  Then I went to the git repo for the JeeLabs plugin and grabbed all of the files there.  There wasn't any documentation so I made a directory called JeeLabs in the plugins folder in the House Agent install directory and copied all the files from the git repo there.  I then restarted the HouseAgent daemon and was able to successfully add a JeeLabs device.

I stopped at this point since I'll need to actually tie in some JeeNode hardware to continue my investigation.  There is a .conf file in the JeeLabs plugin directory that can be used to set the COM port to use and various other things.

There is also a fork of the JeeLabs which appears to be a little more up-to-date here. Even with those changes, when compared to another more up-to-date plugin, like ZWave, it looks like the JeeLabs plugin has been somewhat abandoned.

The web UI is also pretty plain and if I decide to use HouseAgent I'd like to modify it to look a little more snazzy. Right now it looks like an "admin" interface, rather than one that a user would really appreciate.  There does seem to be a branch where someone is working on mobile interface here.

At this point I kind of gave up since it seemed like getting HouseAgent to run was just fixing one bug after another.  HouseAgent seems like a great architecture but would probably take too much time and effort to make usable.

Pros:
  • Written in python (yeah!)
  • Good plugin architecture
  • Web-based UI
Cons: 
  • It doesn't look like HouseAgent has been under active developement in several years.  Has the project been abandoned?
  • In general, it appears to be a little rough around the edges
  • Web UI is a little ugly and not mobile friendly

Wednesday, October 22, 2014

embeddedWorld 2014

I was lucky enough to get chosen to speak at embeddedWorld 2014 in Nuremburg, Germany.  I gave a short presentation on using Yocto to develop a commercial product.  If you're not sure what Yocto is, don't worry, most people don't; it's a tool that helps Linux run on embedded hardware (like your WiFi router, for instance).  Rather than talk about a bunch of technical stuff I'll just stick mostly to just how the trip itself, impressions of Germany, etc.

General Observations
As I was flying from Dusseldorf to Nuremberg, I could see at least 4 nuclear reactors, quite a few windmills, and lots of solar panel installations (many on the roofs of houses and businesses and some empty fields with lots of solar panels in rows).  I also noticed lots of large-scale greenhouses in the farm fields, I couldn't tell if these were permanent installations or just temporary structures built over top of farm fields.  At least from the air, Germany looks very "green".

Once I got to Germany, the language barrier was not a problem at all.  I'd been told that there were alot of English speakers in Germany, but it really seemed that everyone spoke English.  It was funny too because most people would say "my English is not very good" and then they would go on to speak nearly flawless English.

Germany just felt very comfortable to me for some reason that's hard for me to articulate.  And I guess the Germans thought so too, because they almost always would initially speak German to me, until I asked "Sprechen Sie Englisch?".  The other people that came over with me from the States would usually get English right off the bat from the Germans they met.

We had several people also attending the conference from NI's Munich Office, and they were outstanding hosts, taking us to dinner each night and generally helping us out in any way.

I also found that business etiquette was a bit different:
  1. It's expected to wear a suit and tie, the US standard of a button up shirt and khakis doesn't cut it.
  2. Don't be late.  You'll get some very disapproving stares if you aren't punctual.
And this should surprise no one: Germans know beer.  Every beer I had there was excellent (and I had quite a few).  Don't worry about getting something you won't like; just drink it and it will be good.

I didn't have any time for sight-seeing so this is a crappy pic I took in downtown Nuremburg


Embedded World Exhibition Floor
The Exhibition part of Embedded World was crazy-huge, with 856 exhibitors and 26,000+ visitors.   It took me a long time just to do a relatively quick walkthrough of the floor.

I kept my eyes open for any LabVIEW front panels and I saw quite a few.  One of particular interest was a cool looking demo from Intel.  It's a slightly creepy looking insectile robot that plays the Chinese mandolin (not sure what the real name of the instrument is).  You can see the LabVIEW front panel on the monitor in the picture below.  The Intel guy running the demo couldn't say enough good things about developing in LabVIEW.


Presentation
My presentation went really well.  Almost every seat was filled; probably around 50 people.  I got some good questions and some compliments after it was over.  I also talked for a while with a couple of Intel guys that are heavily involved in the Yocto project.

Flight Back
The flight back was the only negative part of the whole trip. Coming in through Customs Stateside is no fun.  'Nuf said.

Wednesday, October 15, 2014

First open source patch accepted

I was about to post about my first patch accepted to an upstream open source project, but then I started digging around and discovered this one was actually my first!

I'm not trying to toot my own horn (ok, I am a little), I was just proud that I actually have some small, insignificant bits of code contributed to the open source community.

If anyone is remotely interested the first patch is to the Busybox project to fix a bug whereby a linked local network interface will keep getting a different IP between reboots when it should be getting the same IP on subsequent boots.  I can see your eyes glazing over...

The second patch is to the Yocto project and has to do with the generated entropy on an embedded Linux system.  Basically, if there's not enough entropy in the system then random numbers become much less random which can be a security risk if those random numbers are used for something related to cryptography.

And I guess to add to that I have lots of commits submitted to repos here and here, but those are repos owned by the company I work for so I wasn't counting those.


Wednesday, October 30, 2013

Wolverine claws for Halloween

A friend is wearing a Wolverine costume for Halloween, and he asked me to help him make some wooden claws.  He wanted them made out of thin (brittle) wood so no one would mistake them as actual weapons.  Although we haven't tested them, we're pretty sure the claws would break very easily if anyone tried to use them as a weapon.

I didn't think to take any pictures while we were making them but here are the final results:


Sunday, February 03, 2013

Scale results, round 2

I made a second run on my scale tester.  This time I used a 10KOhm thermistor as my temperature sensor.  This gave me around 0.15 degrees (F) of resolution, compared with the 1 degree resolution of the previous temperature sensor I used for the last test run.


Figure 1: Weight and Temperature vs. Time

The first graph this time is the usual weight and temperature over time.  You can see that the weight and temperature appear to be highly correlated just like the first test run. The other thing is that the temperature appears much less noisy then in the previous run.

Figure 2: Nominal weight minus weight vs. Average temperature
In Figure 2, I graphed the delta in weight vs nominal against a moving average of temperature.  I also threw down a best-fit linear trend line.  I can immediately see that the point cloud is much tighter than in the previous test run, which seems good.

Figure 3: Adjusted weight

The last graph is a plot of the weight reading adjusted by the trend line equation from Figure 2.  The ideal line is a straight line at 55 lb. Clearly the line is not straight but it certainly improves the data.  The weight reading varies by +/- 0.2 lb instead of +/- 0.75 lb for the unadjusted weight readings.

Conclusions

The adjusted weight did not seem much different from the previous test run, but it still seems useful.  I think I can now go on to implement the data logger for this project which will convert weight and temperature sensor readings to specific gravity.

There are still some unknowns here.  One is that the test runs have only been run on a constant 55 lb test weight.  It's certainly possible that the numbers will change if a different weight is used.  It might be worth re-testing with weights of 45, 65, and 75 lb weights.

Additionally, there seems to sometimes be a lag between temperature changes and weight changes.  This could be attributable to the temperature sensor and scale having different thermal mass, which is almost certainly true.  I could account for this by attaching the temperature sensor to the scale with thermal paste to ensure that they are at relatively the same temperature.

Tuesday, January 22, 2013

First scale test results

I took some time to analyze the results from my scale test.  If you like graphs, then keep reading.  If you don't like graphs then skip to my conclusion at the bottom.  I happen to like graphs...

To summarize the previous post, I wanted to see if there were two effects happening to my fancy new RS232 scale: 1) temperature and 2) sensor drift (or creep).  The easiest way to track this was to measure the weight of an object with a constant mass over time, while also measuring temperature over the same time span.  I did that and now have a week's worth of measurement data to sift through.

Figure 1: Temperature and Weight vs. Time
First I graphed weight and temperature each versus time.  Figure 1 shows this graph.  You can immediately see that the measured weight correlates closely with the temperature, so clearly I was right that there is a temperature effect.  The second thing to note is that the weight line shows clear quantization, but this is to be expected as the scale only specifies to have a 0.1 lb resolution (but it's still nice to see it clearly in the graph).  Another thing to note is that the temperature is pretty noisy.
Figure 2: Average Temperature and Weight vs. Time
Figure 2 is the same graph but with a moving averaged temperature.  Perhaps a "moving average" is not the correct term for this; I never did much with formal statistics.  I basically just calculated each reading by taking the mean of the previous 6 readings.  You can see the temperature line looks much less noisy now and the correlation between temperature and weight still remains.

Figure 3
My next task was to try and figure out the mathematical relationship between weight and temperature, so that I can then (hopefully) correct for temperature and get a more accurate weight reading.  The graph for weight versus temperature is shown in Figure 3.  There are several interesting things here.  The first is that you can see that both the weight and the temperature are quantized since all the blue points in the graph come out on grid lines.  The next thing to note is that the point cloud is pretty widely distributed (which isn't good).  I had Excel generate a best fit linear trend line.
Figure 4
Next up I repeated that graph (Figure 4) but with the the averaged temperature data from Figure 2.  Now you can see that the quantization in the temperature data has disappeared but remains for the weight, which is what we'd expect.  The trend line has changed a little based on this adjustment.  I also threw a 6th order polynomial fit trend line on the data to see if that would fit the data better, but as you can see that is nearly a straight line, so we'll stick with the linear fit line for future calculations since it seems to be a pretty good approximation (at least compared with a polynomial fit).
Figure 5
Now from this we can use the calculated trend line to create a mathematical attempt at canceling out the temperature effect of the scale readings.  Figure 5 is a graph of the temperature-adjusted weight plotted over time.  The ideal line would be a line that is constant at 55 lb.  The adjusted weight line is clearly not a straight line but if you compare it to Figure 2 we have certainly made an improvement over the raw weight readings.

As it stands this temperature correction is probably useful enough that I could start using the scale for continuous weight measurements, however I'd like to make it better if I can.  I think one improvement I can make (which I mentioned in my previous post) was that my temperature sensor has pretty low resolution (about 1 degree Fahrenheit). I suspect that having a sensor with 0.1 degree resolution would help, and might bring the point cloud in Figure 3 into a tighter cloud which would make the generated trend line more accurate.  So now I'm going to start looking around for a more suitable temperature sensor (I might already have one on hand in my parts library) and re-run the test to gather fresh data.

Zeo sleep monitor


My wife got me a new toy for Christmas this year, a Zeo Sleep Monitor. It's a device that fits on your forehead while you sleep and measures your brain waves while you sleep. Based on your brain waves it logs what phase of sleep you're in (light, REM, deep, or awake). I got some time to try it out a few nights ago and I was pretty impressed!

Above, you can see a screenshot from the app on my phone. You can see for yourself what each of the colors means on the graph above.  The fun thing to note for me is that it lines up perfectly with what happened that night.  At around 1AM (the second set of red lines) my dog woke me up to be let outside.  Then around 2AM my wife woke up which woke me up for a little while.  Then at around 6:30AM my wife woke up to get ready for work which again woke me up.  So that correlates the data with reality nicely.

The interesting things in the graph are what I wouldn't ordinarily be able to determine for myself, namely differentiating between light sleep, deep sleep, and REM sleep.  I find this pretty fascinating.  I think this also means that I don't have sleep apnea (or at least not this night), since I would assume there would be many more red lines throughout the night.

I'm going to keep using this as much as possible for the next few weeks to get an idea of what my sleep habits look like over time.  The Zeo Android app also has another feature whereby you can set an alarm and the app will try to wake you when you're in an optimal sleep state.  This works on the theory that you feel better and more alert if you're awakened when you're in a light sleep state.  I haven't tried that feature yet, but I will soon.

When I find some time I'd like to find a way to use the Zeo sensor to monitor my sleep cycles and when I'm in a REM sleep cycle trigger subtle lights or sounds that might allow me to experience lucid dreaming.  I found this Android API which may aid me in doing that.

Update: I tried the alarm feature last night and it is amazing!  It delayed my wakeup time by about 15 minutes to wait for the REM cycle I was in to end.  I woke up feeling fantastic!  I may have to start using it every night.

Wednesday, January 09, 2013

Testing an RS232 scale

To further the experiments I've been doing with measuring specific gravity, I needed to take long-term continuous weight measurements (5-10 days total). I started searching for a scale or load cell that would be appropriate.
My specific use case involves monitoring the weight of an object in the range of 50-70 lbs for 2 weeks.  Since we have a heavy weight on the scale for a long time a problem that could come up is sensor drift (also sometimes called creep).  This effect is similar to what happens if you hang an object from a suspended spring.  Over time the spring will slowly deform.  The rate of the deformation depends on many factors like the weight of the object and the physical properties of the spring.  The same thing happens with a scale.  Although mechanically different from a suspended spring, in many other ways it's very much like a spring.

Another factor that can throw off the readings from a scale is temperature.  As the temperature changes the properties of the components in the scale also change.  If these changes aren't compensated for in some fashion then they will affect the scale's readings.

I initially tried to measure a 55 lb test weight using a 75 lb maximum capacity digital scale.  Within minutes the scale's readings started drifting.  I assumed that this was probably due to creep and was probably so prominent because I was weighing something close to the rated capacity of the scale.  This scale also had the additional failing that it did not have a way to communicate externally (which as you'll see soon was an important requirement) so I decided to look for a different scale.

I reasoned that if I found a scale that had a maximum capacity that was significantly larger than object I was weighing, then it might not display significant effect from creep (or at least for the 2 week period that I needed continuous readings).


Luckily I found a 300 lb capacity shipping scale (MyWeigh HD-300), and a well-written tutorial from Adafruit.  This scale was a little more expensive than what I had in mind, but it's worth the price considering all of its features:
  • 300 lb capacity
  • RS232 communication
  • ability to disable auto-off (most scales turn off automatically which sucks for continuous measurements)
I quickly started an "eyeball" test by again placing my 55 lb weight on the new scale.  I kept a log book near the scale and roughly every 60 minutes I would write down the time and the displayed weight.  I left this experiment running for about 4 days.  I should note that I didn't stick to the 60 minute test interval that closely.  Sometimes I would leave several hours between readings, sometimes it was more like 30 minutes, and I didn't wake up to take readings in the middle of the night; I like science but I like sleep more.

The results of this test told me that something was causing the displayed weight to vary by about 1 lb over the course of 4 days.  I had a suspicion that temperature was causing much of the variation (the weight would be lower when it was cooler in my house and higher when the temperature was higher).  I couldn't really tell if there was any effect from sensor creep.

Next I decided to repeat the above experiment but make it a little more scientific.  For this run I wanted to run for at least 10 days and gather temperature and weight readings every 10 minutes.  Of course, this is exactly what computers are made for.

The test set up consists of a python script running on an old laptop.  The script communicates with the scale via its RS232 interface to gather weight readings.  To get the temperature I decided to use an Analog Devices TMP36 sensor that I already had on hand.  Coincidentally, Adafruit had another tutorial on using this sensor with an Arduino.  I used some of the ideas from the tutorial but wrote my own Arduino firmware to make it act as a serial thermometer.

The test script on the laptop was modified to also query the Arduino for the temperature and log the returned value along with the measured weight value to a file every ten minutes.  

The test setup from left to right: laptop power supply, USB wifi dongle, scale control box, laptop, plywood to act as stable platform for scale, Arduino with TMP36 sensor, MyWeigh HD-300 scale with 55 lb test weights
I put the source code for the python test script and the Arduino firmware on github.  Keep in mind that the script was written to run on Windows and would need to be ported to run on another operating system.  Also, since I implemented the script very quickly I didn't spend much time or effort on error checking so it's not very robust in that respect.  You have been warned.


At this point you may be wondering why I didn't just use the Arduino by itself to do the data logging.  I have a few reason for that:
  • I needed a circuit to convert the RS232 voltage levels of the scale to TTL voltages that the Arduino can understand.  I already had the hardware to do that but I didn't want to waste time assembling it when I had a laptop with a perfectly good RS232 port available.
  • I didn't have an Real-Time clock to keep track of time or anything to use for large data storage (SD card socket).  The Adafruit data logging shield would have been ideal for this but I didn't want to wait to run the test.
After I was half way through implementing the test I realized that the TMP36 sensor used in combination with the Arduino's 10-bit resolution ADC only gives a resolution of about 1 degree Fahrenheit.  I would have preferred to have 0.1 degree of resolution but decided to run the experiment anyway and see how the numbers looked.

I'll create an additional post with the results from the first test run.

Improved Security Node

I've spent some time recently polishing the Security Node demo I made a while back to the point where it is no longer a demo.  It's now installed and functioning in my house.

Here are some of the changes:

  • Integrated catisith2's keypad interface code
  • Added logic so alarm system is run completely by the JeeNode
  • Replicated original functionality of the DSC alarm control board
  • Added circuit to control the (very loud) siren
  • Send radio packets when events occur (alarm, arm, disarm, doors open/close)
  • Handle remote commands via radio (mainly arm/disarm commands)
  • Made a small "cheatsheet" with all the commands to attach inside the keypad panel

I've update the source code in my github repo.

I'm pretty satisfied with how the Security Node turned out but I have some things I'd like to change:

  1. The alarm system runs fine locally but my ultimate goal is to have an external interface so I can receive texts when events occur and remotely arm/disarm the system.  I'm still trying to figure out how I want to do that.  JC Wippler is doing some interesting research along these lines.
  2. There isn't much security with the arm/disarm radio messages, though I could encrypt the radio traffic pretty easily.
  3. The final board works well but it looks ugly.  I'd like to redraw everything in EagleCAD and have a proper PCB made.
  4. Adding a battery backup so the alarm will still work when there is a power outage.
Here are some pictures:

Security Node without JeeNode installed

Security Node installed

Keypad communicating with JeeNode


Tuesday, January 08, 2013

Beer Crate

Over the holidays, I set out to build some more permanent storage cases for my homebrew beer.  I had just been using whatever cardboard beer boxes I could get my hands on.  Now that I'm getting more into homebrewing I thought it would be nice to put my woodworking skills to good use.

The finished beer crate
Design
Design decisions:
  • Be easily stackable (up to 3 or 4 high)
  • Some sort of locking/registration mechanism so when they're stacked they stay stacked
  • Separators between bottles so the bottles don't knock together when moved
  • Sturdy!
  • Some method of identifying what beer is in a given case
  • Hold at least 12 bottles (24 seems like too much)
  • Tall enough to hold any normal 12 ounce beer bottle
  • Handles for ease of carrying
I started by measuring a cardboard beer box to get some general size guidelines.  I also measured the tallest 12 ounce beer bottle I could find to see what the height needed to be.

Based on the measurements I designed the beer crate in Sketchup (as usual).  I decided to use 3/4 inch pine boards for the sides and end pieces and 1/8 inch hardboard for the bottom and the separator pieces.  There are two interesting features: The first is that I plan on applying chalkboard paint to the sides of the crate so I can write info on the batch in chalk.  The second interesting feature is a trick I learned from woodgears.ca.  The idea is to use marbles to "lock two flat surfaces together in a removable fashion.  The idea is to drill two hols on the two surfaces just wide enough and deep enough to fit a marble.  The marble then sits above the surface of the top edge end piece and fits into a matching hole on the bottom of the end piece.  In this way the crates can be stacked without worrying about them slipping.  Since the marble is spherical it's easier to line up than a cylindrical peg.


The beer crate design in Sketchup
Construction
The construction details are not that interesting since they are just standard woodworking techniques.  The sides, ends, bottom, and separator pieces were cut to size from pine boards and hardboard sheets.  A slot was cut into the sides and end pieces to fit the bottom piece similar to the way drawer bottoms are traditionally made.  

The hand holds were cut in the end pieces with a forstner bit and a jigsaw, and sanded smooth using an oscillating spindle sander.  The recesses for the marbles were drilled using a drill press and a template I made  to make sure the holes line up properly.
Slots were cut halfway through the separator pieces so that they would fit together.  To make these cuts I used my table saw and just stacked up several separators at a time and pushed them into the saw blade until the blade hit a pencil mark half way through the separator.  There are cleaner ways to make this cut but since the cut is not visible after the seperators are assembled, I wasn't too concerned with cosmetics.  If you'd like to see how these separators work just take a look at a carboard 12 pack box and they go together the same way; they're just made of hardboard instead of cardboard.

I just used a butt joint to connect the side and end pieces.  I put 1.25" wood screws into countersunk pilot holes to hold it.

Finish
I first sanded all the pine pieces mainly to get rid of machine marks.

I used two coats of clear gloss wipe-on polyurethane to seal the side and end pieces.  I didn't put any stain on the wood because I like the look of unstained pine.  I left the outside face of the side pieces unsealed since I wanted to apply the chalkboard paint there.

For the chalkboard surfaces, I first primed with some white latex paint that I had lying around.  After that had dried I sanded lightly and applied one thick coat of black Rustoleum chalkboard paint using a foam brush.  After it had dried it didn't seem to need a second coat so I left it at that.

Future Improvements
This was the first project that didn't require me to make some adjustments to the design during construction.  I credit using Sketchup and doing careful measurements before I started.

Now that I've finished the prototype I need to make 8 or 9 more to hold all of my homebrew beer.  I'm really looking forward to doing some "assembly line" style woodworking.  It seems like 90% of the time in woodworking is spent setting up for each cut, so making 10 of something doesn't take 10x more time than making 1.  I usually only make 1 of a project so it will be fun to make many more.

Even though this project went well I have some concerns and improvements for the future:
  1. I might want to use some nicer wood like oak in the future.  Then again the pine looks pretty good and has the additional advantage of being cheap.
  2. The butt joint isn't that pretty; using dovetails or finger joints would look better.
  3. I'm a little worried that the placement of the marbles may be a little too precise and I might have trouble getting things to line up when I have multiple beer crates.  I can probably get around this by only using two marbles placed above each handle instead of the current 4 marble design.  Also I could make a jig to align the pieces when I drill the pilot holes for the screws.  The jig would ensure that I get the distance between the end pieces exactly the same every time.